Cubesats and Satellite Imagery
Spectral Analysis
By Mark Ciotola
First published on January 30, 2019
The Electromagnetic Spectrum
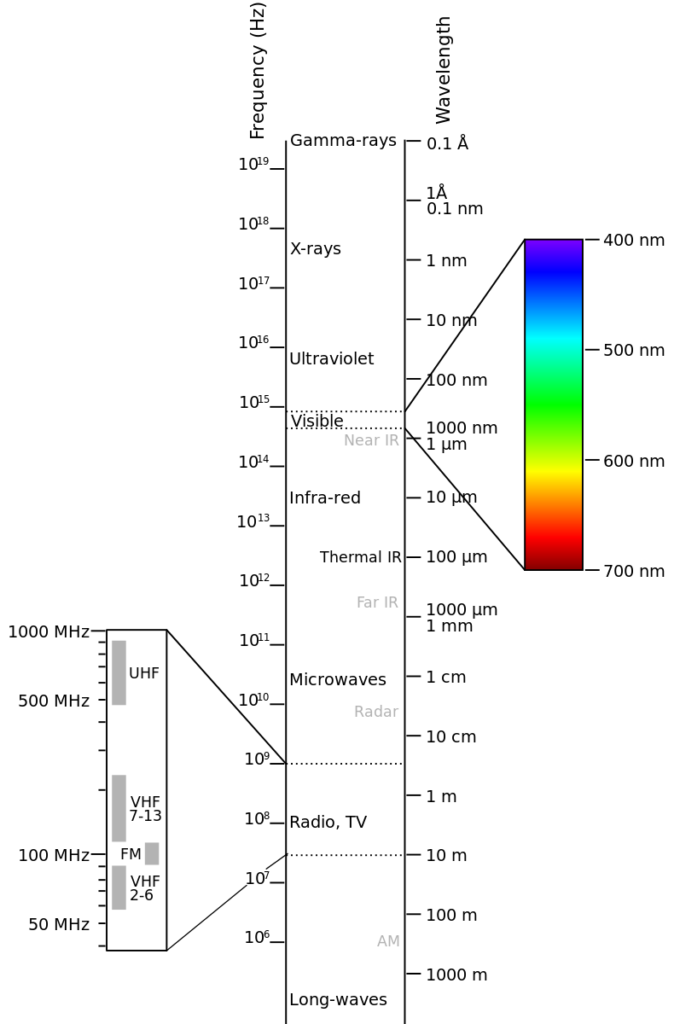
A diagram of electromagnetic wavelengths and their types is shown below. Notice how the visible part of the spectrum is only a small part of the total spectrum.

Electromagnetic spectrum
Types of Spectra
A spectrum is the brightness of light for each wavelength. Many substances exhibit a characteristic pattern of bright and dark parts of the spectrum. There are several types of spectra:
- Transmission: light emitted when electrons emit photons, typically from hot objects or gasses. Typically comprised of bright lines against a dark background. (Works best for hot, glowing objects or lights)
- Absorption: light absorbed by a fluid such as a gas or liquid. Typically comprised of reduced wavelength areas of brightness. (Works best for fluids, particularly in infrared)
- Reflectance: light reflected by an object or area. Will typically appear darker for some wavelengths. (Often best approach for observing solid objects, or ground/water from above; e.g. for geology)
Spectral Options
Need to determine what wavelengths we need to observe: visible, Infrared, UV?
- Diffraction grating (transmission)
- Diffraction grating (reflection)
- Piece of CD (inexpensive, but quality may be insufficient)
- Prism
- Tunable filter
- Multiple detector/filter combinations
- iPhone spectrometer? (but would need an iPhone for each sensor!)
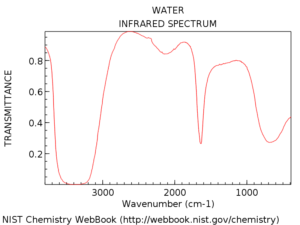
Water Spectrum (NIST)

absorption spectrum for water (NIST)
- NIST water page
- HDF group HDF5 Software
Reference
Spectral grating tutorial (ThorLabs)
« Obtaining, Processing and Analyzing Satellite Imagery | COURSE | Hyperspectral Imagery and Analysis »